


The Night When Things Almost Went Down
Have you ever left for home on a Friday evening feeling confident about your work for the day, at peace knowing your system would survive the coming weekend? We’ve all felt that way at some point.
Meanwhile, the disk on the server had quietly reached 90% utilization. Write-Ahead Log (WAL) files had accumulated enormously, one long-running query had been running for over an hour, and nobody noticed because, some time earlier, the dashboard had looked fine.
After a while, writes to the database started to fail, and you received messages like, “Hey, the DB seems a bit slow?” In reality, the database was no longer slow; it had already gone down.
However, this wasn’t anything new. The signs of trouble had been there the entire time. The monitoring simply wasn’t connected to the right signals to raise the alarm.
And that’s what this post is about.
Dashboards vs Alerts
Let’s be honest. Dashboards are great for screenshots.
However, they make one risky assumption that someone will make this check before it’s too late. Alerts make no such assumption.
- Dashboards = “Here’s what’s happening.”
- Alerts = “There is something wrong. Need to address it.”
A dashboard gently shows an increasing CPU. But an alert rings, saying: “This has been bad for 30 minutes, wake up.”
Dashboards are waiting for us. But alerts find us. After a few incidents, we no longer rely on the dashboard to keep us safe while asleep. It’s through alerts that it happens.
Configuring Alerts in PMM
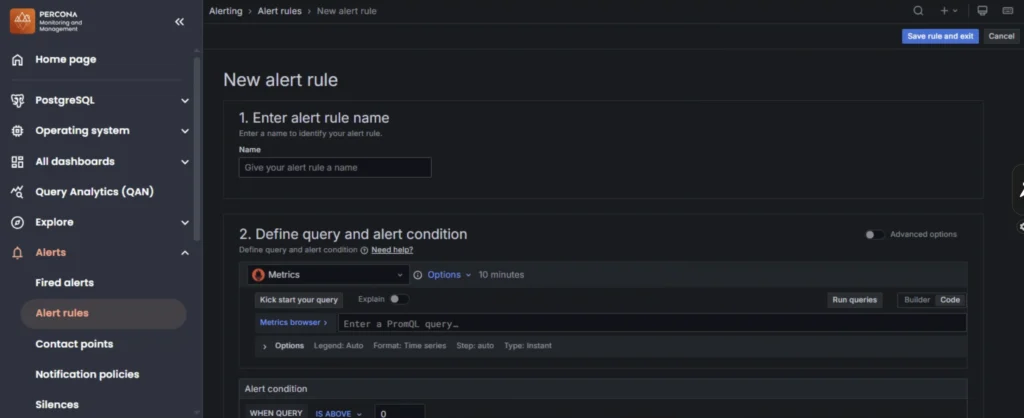
These rules are set up by going to Alerting → Alert Rules in the PMM interface and creating a New Alert Rule. For every alert, we need to configure three things:
Duration: How long the condition must hold before the alert fires. This filters out temporary spikes and reduces noise.
Severity & Routing: Further, we assign a critical or warning severity level, and by using contact points, we can route alerts to the channels where our team responds, such as PagerDuty, Slack, email, or any other channel.
For reference, please find the image below.
Essential PMM Alerts
No theory. These are essential alert rules and are part of a live PMM setup, which could save our system. These alerts are grouped into OS-level health alerts and PostgreSQL-specific alerts, since it’s possible that the entire database process can be healthy while the underlying server runs out of disk space.
Note: Replace <node_name> and <service_name> with the actual PMM service identifiers before using any of the expressions below.
OS Health Alerts
1. Disk Space (Critical)
Condition: Available disk space falls below 10%
(  node_filesystem_avail_bytes{fstype!~"tmpfs|overlay", node_name="<node_name>"}  /
  node_filesystem_size_bytes{fstype!~"tmpfs|overlay", node_name="<node_name>"}) * 100 < 10
When the disk hits zero, PostgreSQL doesn’t struggle. It stops.
WAL files are constantly being written to disk. When disk space runs out, WAL writes fail, checkpoints fail, dirty pages cannot flush to disk, and transactions get stuck. What makes this particularly concerning is that disks never fill up suddenly. It is always gradual; a replication slot that nobody cleaned up, a log rotation that silently broke, a table bloating for weeks or months. This is why monitoring disk space consistently matters; by the time it becomes critical, the earlier opportunities to fix it have already passed.
2. Low Memory (Critical)
Condition: Available memory falls below 10%
(  node_memory_MemAvailable_bytes{node_name="<node_name>"}  /
  node_memory_MemTotal_bytes{node_name="<node_name>"}) * 100 < 10’’
Memory pressure on a database server tends to accumulate gradually. As available memory decreases, query performance drops, the OS begins paging memory to disk, and the system starts swapping. Once that happens, it is not just a slowdown; performance collapses entirely. Queries that normally complete in milliseconds can stretch to seconds, and recovery typically requires a full PostgreSQL restart.
PostgreSQL relies on memory for shared buffers, sort operations, hash joins, and per-connection overhead. Once that headroom is exhausted, the OS begins making decisions on behalf of the database. If pressure continues to build, the Linux Out of Memory (OOM) killer will terminate processes to free memory, and PostgreSQL is not exempt from that.
When this alert fires, the priority is identifying what is consuming memory before the OOM killer intervenes.
3. CPU Utilization (Critical)
Condition: CPU usage above 80% for 5 consecutive minutes
(  1 - avg by (node_name)(    rate(node_cpu_seconds_total{mode="idle"
, node_name="<node_name>"}[5m])  )) * 100 > 80
Brief CPU spikes are expected on any active database server. This alert fires only when CPU stays above 80% for at least 5 consecutive minutes, which typically indicates a structural problem like a query plan regression caused by stale statistics, a missing index on a table that has grown significantly, a runaway autovacuum on a heavily bloated table, or a long-running ad-hoc query that was never terminated.
PostgreSQL Alerts
4. PostgreSQL Down (Critical)
Condition: pg_up == 0
PMM collects metrics by querying the database over a live connection. If that connection fails, pg_up returns 0. The cause could be a crashed postgres process, a blocked port, or invalid credentials, but from the application’s perspective, the distinction does not matter. The database is unreachable either way.
This is not a performance alert. It is a downtime alert. If PostgreSQL is genuinely down, an incident is already underway. This alert gets immediate attention; there is no “I’ll look at it later” with this one.
5. Too Many Connections (Critical)
Condition: Active connections above 80% of max_connections
(sum(pg_stat_activity_count{service_name="<service_name>"})
/pg_settings_max_connections{service_name="<service_name>"}) * 100 > 80
PostgreSQL’s connection limit is a hard ceiling, not a soft threshold. Once it is reached, new connections are rejected with ‘FATAL: sorry, too many clients already’. Applications fail, and users are immediately impacted.
This alert fires at 80% because that is where investigation is still possible, like leaked connections, a deployment that unintentionally doubled the connection pool size, or idle sessions that were never properly recycled.
Increasing max_connections is not a straightforward fix. Every connection carries memory overhead, and raising the limit significantly without accounting for that can destabilize the server. The proper solution is a connection pooler such as PgBouncer, which manages connection load without increasing per-connection memory pressure. This alert exists to give us time to make that decision before the hard ceiling makes a decision for us.
6. Unexpected Restart (Warning)
Condition: PostgreSQL restarted within the last 5 minutes
changes(pg_postmaster_start_time_seconds{service_name="<service_name>"}[5m]) > 0PostgreSQL does not restart on its own without a reason.
This metric tracks the start time of the postmaster process. If that timestamp changes within a 5-minute window, a restart occurred. The more dangerous scenario is when PostgreSQL recovers cleanly as everything looks healthy, and nobody investigates. But something caused that restart, and it has not resolved itself.
Was it an OOM kill? Did someone run pg_ctl restart without communicating it to the team? Was it a crash caused by a faulty extension? Each of these has a different cause and requires a different response. The PostgreSQL logs should be examined immediately when this alert fires.
7. Long-Running Query (Warning)
Condition: A query running for over an hour.
max(pg_stat_activity_max_tx_duration{ service_name="<service_name>", state="active" }) > 3600In most production systems, a query running for over an hour is almost always a symptom of an underlying problem like a missing index, a plan regression after statistics were last updated, or a join that performed acceptably on a small development dataset but is now scanning tens of millions of rows in production. That said, there are cases where a long-running query is expected, such as scheduled batch jobs or reporting queries that are known to take time.
Before terminating it, we should understand what it is actually doing and what is the purpose it serves. Terminating it without understanding the root cause means the same query will surface again, likely under the same conditions.
8. Long Idle in Transaction (Warning)
Condition: A transaction is idle for more than an hour
max(  pg_stat_activity_max_tx_duration{    service_name="<service_name>",
    state=~"idle in transaction|idle in transaction \\(aborted\\)"  }) > 3600
This is typically more disruptive than a long-running query. At least an active query is making progress. An idle in transaction session has opened a transaction, acquired locks, and stopped executing entirely. No work is being done, but the transaction remains open, locks are held, autovacuum is blocked on those tables, and the connection slot is occupied.
A healthy transaction completes in milliseconds to seconds. A transaction that has been idle for over an hour means something went wrong, an application bug, a process that died without issuing a rollback, or a client that disconnected without closing the transaction cleanly. These do not resolve on their own and must be investigated manually.
9. Wraparound (Warning)
Condition: pg_database_wraparound_percent greater than 75
pg_stat_database_wraparound_percent{service_name="<service_name>"} > 75If we ignore this long enough, PostgreSQL will literally shut the database down to protect our data. No warning. No grace period.
PostgreSQL uses 32-bit transaction IDs, giving it a range of approximately 2 billion transactions. As the counter climbs, old row versions must be frozen so they remain visible to future transactions. This is handled by autovacuum under normal conditions. When autovacuum falls behind due to heavy write load, bloated tables, or blocking transactions, the counter continues climbing unchecked. Once the hard limit is reached, PostgreSQL shuts down the affected database and rejects all incoming connections.
Here, At 75%, there is still time for us to act. But if the percentage is actively climbing rather than holding steady, we need to investigate why autovacuum is falling behind.
10. Table and Index Bloat (Warning)
Conditions: Table bloat above 70%, Index bloat above 60%
pg_stat_user_tables_table_bloat_ratio{
  node_name="<node_name>",
  service_name="<service_name>"
} > 70
pg_stat_user_indexes_idx_bloat_ratio{
  node_name="<node_name>",
  service_name="<service_name>"
} > 60
Every UPDATE or DELETE in PostgreSQL leaves behind dead row versions. Autovacuum reclaims them under normal conditions. When it cannot keep pace, dead rows accumulate on disk, queries spend time reading past them, and storage grows without bound. Performance degrades gradually and is often not noticed until it becomes significant. When table bloat crosses 70%, the overhead becomes measurable, sequential scans take longer, shared buffers fill up with dead data, and autovacuum itself takes longer to complete each cycle because there is more to clean up.
Index bloat is frequently the more disruptive problem. A bloated index contains gaps and dead entries, forcing index scans to read far more pages than necessary. A heavily bloated index on a busy table can significantly increase query times even when the table itself appears healthy from the outside.
The Silent Killer of Effective Monitoring: Alert Fatigue
Alerts get created. Then a few more get added. Then the phone buzzes 40 times a day, and the team stops responding to any of it.
This is how monitoring quietly fails. The alert exists, the thresholds are set, but the signal has been buried under so much noise that nobody acts on it anymore. That is exactly the situation where a real problem goes undetected.
Good alerting is not about catching everything. It is about reliably catching what matters. If a warning fires daily because the threshold is set just below where the system normally operates, that is not monitoring; that is noise. The goal should be that every alert that fires is something worth waking up for.
Conclusion
Monitoring is not about watching graphs and feeling productive. It is about catching problems while there is still time to act.
Before the disk runs out. Before connections are exhausted. Before autovacuum falls so far behind that it cannot recover. This is where a properly tuned alerting system pays off, while a poorly configured one results in incidents, sleepless nights, and lost credibility with the team.
At Stormatics.tech, this is the work we do day to day: not textbook configurations, but alert setups calibrated to how production systems actually behave under load.
When an alert fires, investigation is the only option we get. The one we dismiss might be the one we spend all night dealing with.