PostgreSQL Architecture and Performance Health Check
Prevention is better than a cure.
Just like a regular check-up catches issues before they become critical, our PostgreSQL Health Check exists to elevate PostgreSQL by providing the expertise required to unlock its full potential for critical data workloads. We identify the early signs of risk and provide clear fixes that can keep your database operating in peak condition:
- Faster Queries: Reduce response times by up to 75%
- Maximum Reliability: Achieve 99.99% uptime
- Scalability: Optimize your database for future growth and demand.
Delivered by PostgreSQL experts, this service surfaces performance bottlenecks, misconfigurations, and availability risks before they impact your users. With proactive, production-tested insights, your team can operate with clarity and your systems can grow with confidence.

5 good reasons to get a PostgreSQL health check
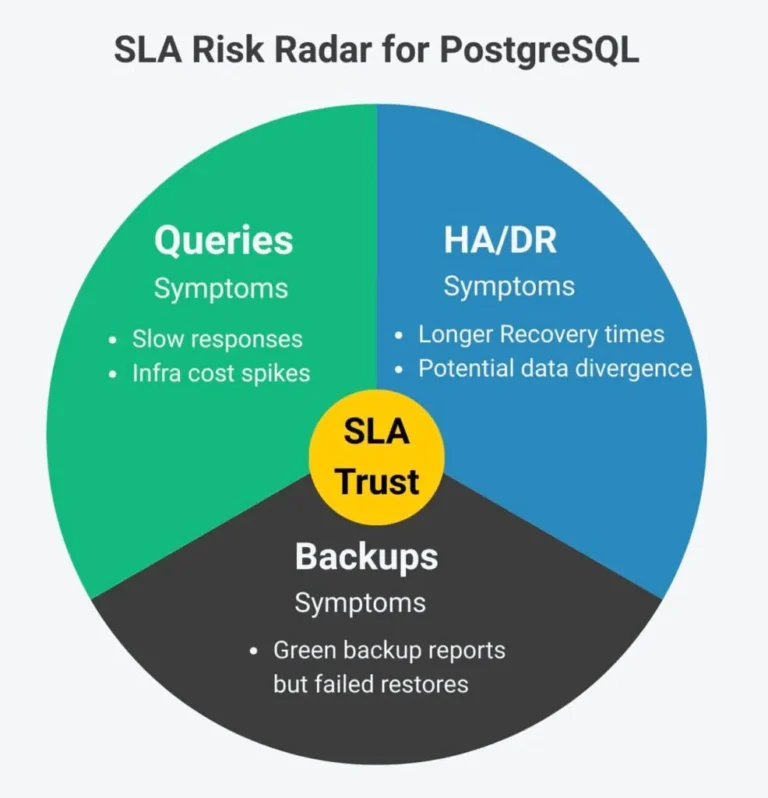
During our PostgreSQL health checks, we address hidden risks that could impact SLAs, ensuring your production commitments remain as strong as your contracts.
How we perform a PostgreSQL health check
Our consultants work with your team to evaluate your database’s performance, security, and configuration. The health check is guided by a proven approach developed through years of hands-on PostgreSQL experience, covering steps such as:
Case study: maximized PostgreSQL performance
Ventrata, to achieve maximum performance gains, switched to AlloyDB from CloudSQL. Over time, the situation deteriorated as query execution times increased from less than 5 ms to 50 ms.
The Stormatics team was brought in to fix the performance issue at hand. The team reviewed system parameters and query planning metrics in detail. The following problems were determined:
- Virtually all of the time was spent on planning the queries. This time delay affected both newly created tables as well as tables with newly created partitions.
- There was an unusually high number of Object identifiers (OIDs) being used, which was expected, however, AlloyDB had a bug that was further aggravating these issues.
Deliverable
A comprehensive report providing actionable recommendations to enhance performance, ensure a robust and reliable business application, and establish a scalable architecture.
Ongoing PostgreSQL optimization
Stay ahead of issues with a quarterly health check that proactively tunes your database for performance, reliability, and growth. With regular assessments by PostgreSQL experts, you can scale confidently, without having to remember to schedule checks manually.
Frequently Asked Questions (FAQs)
Q: What is a PostgreSQL Health Check?
A PostgreSQL Health Check is a comprehensive audit of your database environment, covering performance, security, and configuration. Regular health checks help prevent downtime and optimize performance.
Q: How do I check the health of PostgreSQL?
You can check the health of PostgreSQL by monitoring key metrics such as CPU usage, memory, and disk I/O. A detailed health check evaluates performance, identifies bottlenecks, and provides recommendations for improvement.
Q: How do I check PostgreSQL performance?
PostgreSQL performance is typically analyzed by reviewing query execution times, index usage, and transaction rates. Tools like `EXPLAIN` and `pg_stat_statements` can help identify slow queries for optimization.
Q: How do I make sure PostgreSQL is running?
You can verify that PostgreSQL is running by using the `pg_isready` command, which checks if the server is responsive and accepting connections.
Q: How do I check conditions in PostgreSQL?
Conditions such as query load, connection limits, and disk space are monitored using PostgreSQL’s internal statistics and system monitoring tools. Anomalies are flagged during the health check process.
Q: How do I check my PostgreSQL database?
You can check your PostgreSQL database health by examining metrics like database size, table bloat, and unused indexes. Regular checks ensure that your database remains optimized.
Q: What are the best practices for monitoring PostgreSQL?
Best practices include setting up automated alerts for critical events, using monitoring tools like `pg_stat_activity` for query tracking, and following regular maintenance routines for optimal performance.
Q: How do I monitor a PostgreSQL server?
A PostgreSQL server can be monitored by tracking system resources, query performance, and replication status. Tools like Prometheus and Grafana are often used to visualize this data.
Q: How do I check running queries in PostgreSQL?
You can use the `pg_stat_activity` view to see all currently running queries, helping to identify any that may be causing performance issues.
Q: How do I check PostgreSQL running status?
The running status of PostgreSQL can be checked using the command `systemctl status postgresql` (or an equivalent command, depending on your environment).
Q: How do I check if PostgreSQL is running in a container?
If PostgreSQL is running in a container, you can check the container status using Docker commands like `docker ps`, and verify the database within the container is functioning as expected.
Q: What are database health metrics?
Database health metrics include query response times, cache hit rates, deadlock counts, and replication lag. These metrics provide insight into the performance and reliability of your PostgreSQL database.
Q: How do I maintain database health?
Maintaining database health involves regular monitoring, performance tuning, and updates. Regular health checks help keep your PostgreSQL environment optimized.
Q: How do I check PostgreSQL sessions?
You can check active sessions in PostgreSQL using the `pg_stat_activity` view, which shows details about current connections and queries.
Q: How do I check if a PostgreSQL database exists?
The existence of a PostgreSQL database can be confirmed by querying system catalogs or using tools like `psql` to list all available databases.
Q: How do I check replication health in PostgreSQL?
Replication health is checked using the `pg_stat_replication` view, which shows details on replication delays and the status of standby servers.
Q: What kind of business requires a quarterly PostgreSQL health check?
Quarterly health checks are ideal for businesses running PostgreSQL in mission-critical environments where uptime, security, and performance directly impact revenue or customer experience. This includes fintech platforms, SaaS products, and data-intensive applications that need regular validation of their setup to stay aligned with growing workloads and compliance requirements.
Related Resources
Webinars