For 2015, once again, Gartner’s Magic Quadrant for Business Intelligence and Analytics Platforms ranks Tableau pretty much at the top. How powerful would it be to combine Tableau with the world’s most advanced open source database, PostgreSQL, to create reports and analytics for businesses? This HOWTO walks you through the process of connecting Tableau with PostgreSQL and creating a simple report.
This HOWTO is based on the following configuration:
- Windows 7
- Tableau 9 Desktop
- PostgreSQL 9.4.1
You can download the database used in this post here.
Let’s create our first report!
Connecting to PostgreSQL
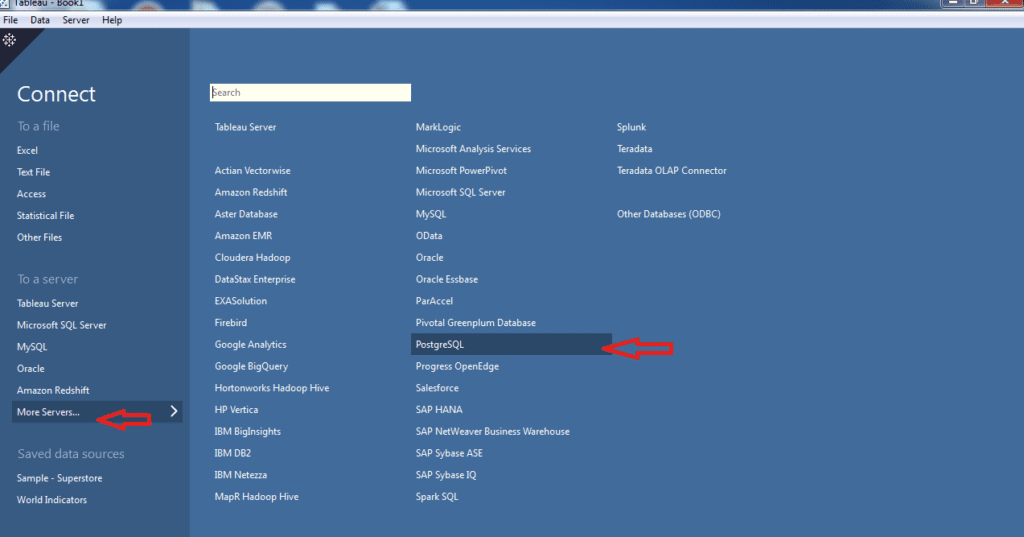
- Launch Tableau. Click ‘More Servers …’ and select PostgreSQL from the menu as illustrated in the following screenshot:
- Fill in the PostgreSQL connection properties and hit OK. If you don’t already have the required connection libraries installed, you will get an error as seen in following screenshot.
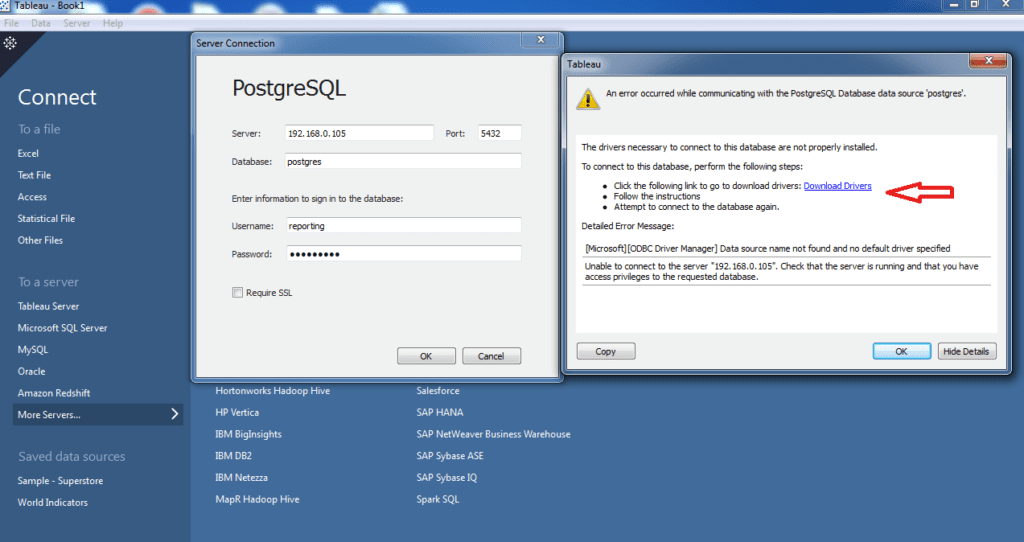
- The (rather helpful) error dialog provides a link to download the libraries, click on it (requires working internet connection). This should take you to the driver’s section on Tableau’s official website. Locate PostgreSQL and download the corresponding setup file. See following screenshot for reference:

- Run the downloaded file (may require administrator privileges). This will setup ODBC drivers and all system configurations required for PostgreSQL connectivity. Once you have completed setup, run Tableau Desktop again and connect to the PostgreSQL database you downloaded before the 1st
Creating a simple report
- Once connected, you’ll find yourself on the Data Source tab. It lists the server, database and the tables as shown in the screen below.

- You can drag and drop the tables you want to use. Alternatively, you can write a custom SQL for the required dataset. For the purpose of this blog, I have dragged and dropped ‘sales’ table. You can take a peek at a preview of the dataset in the result section of the window. Please note that you may have to click ‘Update’ in result pane to preview the result.

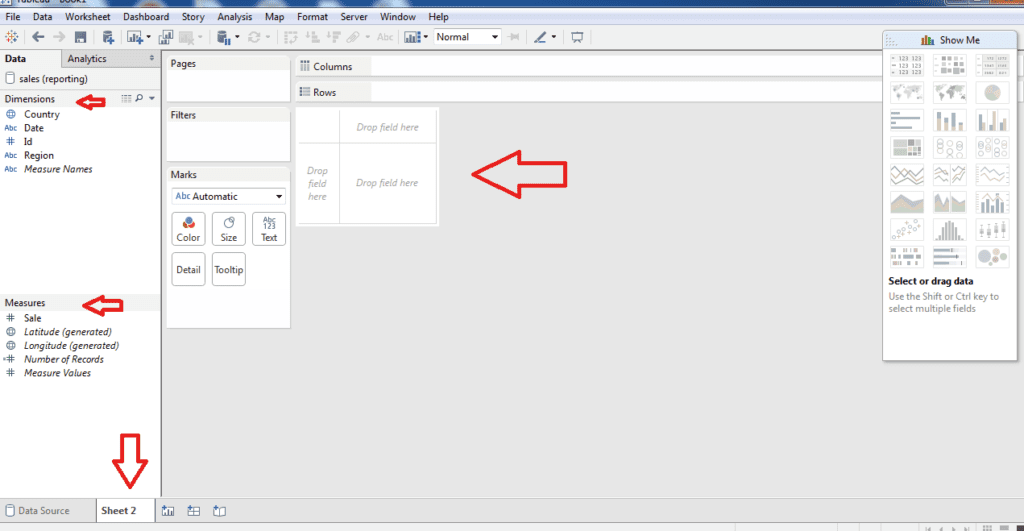
- Click ‘Sheet’ tab (sheet2 in our example) to open the report sheet. The tab on the left will show 2 headers: Data and Measure. The former lists available dimensions whereas the latter lists all measurable values. Right pane in the window shows a pivot table like structure.
- Now, let’s create a simple report that lists out sales and dates by country. To do this, simply drag ‘Sale’ measure and drop it on the data area in the pivot table. Now drag ‘Date’ and ‘Country’ from ‘Dimensions’ section and drop in ‘Rows’ area. And that’s it!
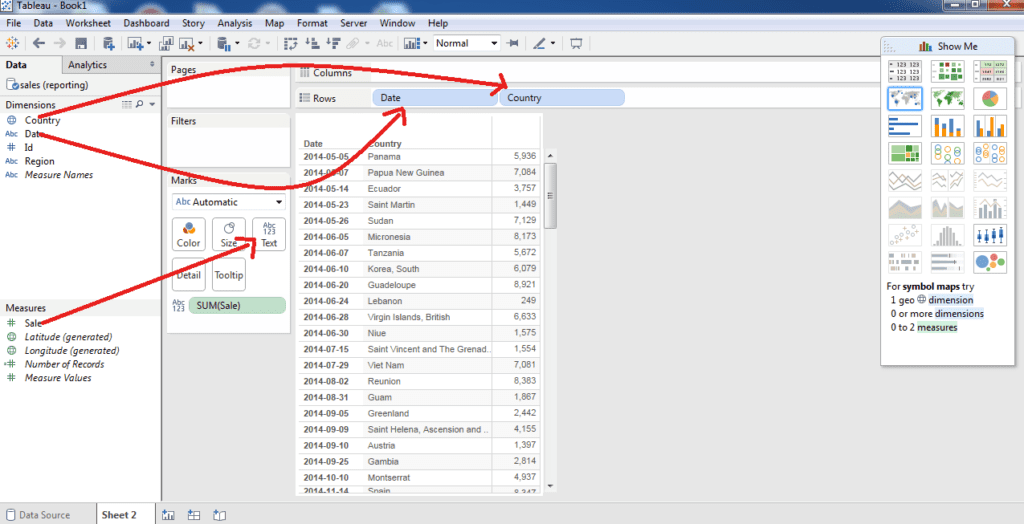
Refer to following screenshot for reference.
Adding extract criteria
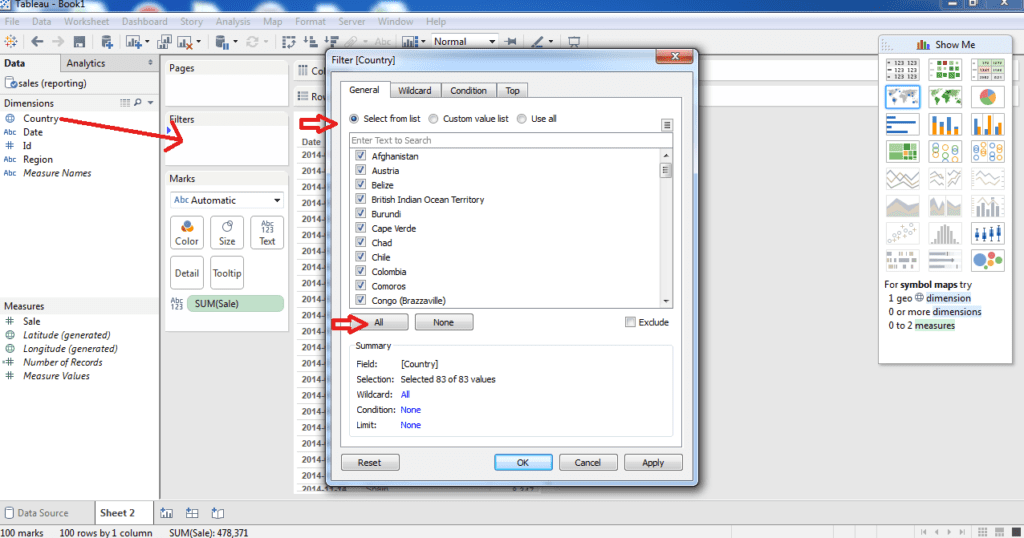
- Next, let’s try to filter the results by country. Start by dragging ‘Country’ from ‘Dimensions’ and dropping it in the ‘Filters’ area. In the dialog box that opens up, under the ‘General’ tab, click on ‘Select from list’. Next, click ‘All’ to select all the countries to show up and press OK.
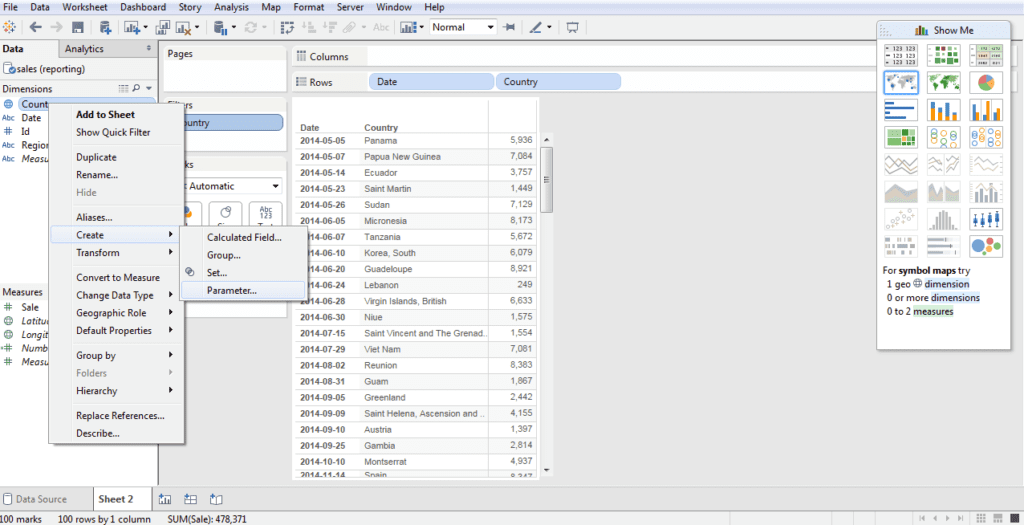
- Right-click ‘Country’ under ‘Dimensions’ and click Create -> Parameter.
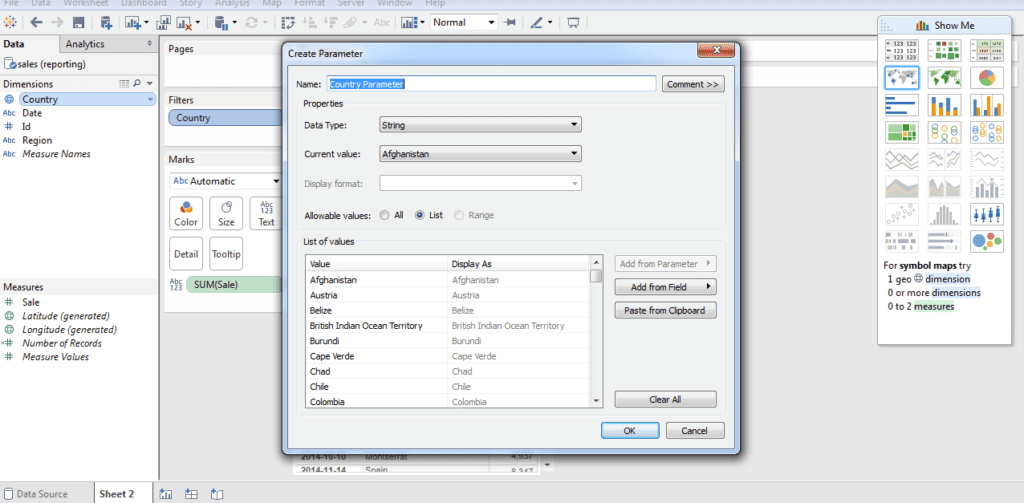
- The next dialog box specifies various properties for the parameter we are creating. Enter ‘Country Parameter‘ as Name, String as data type, and ‘List’ as ‘Allowable Values’. This last selection forces the user can to select a country name from the provided list. Click OK to confirm parameter properties.
- ‘Country Parameter’ now appears under ‘Parameters’ section in the left pane.

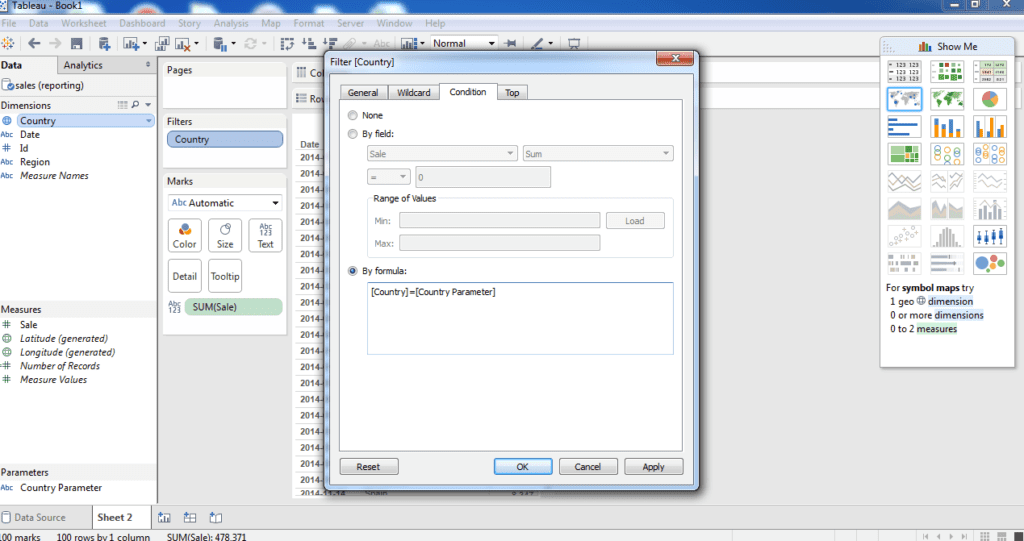
- Now open ‘Country’ filter properties and go to ‘Conditions’ tab. Select ‘By Formula’ and key in ‘[Country]=[Country Parameter]’ as shown in following screen shot. Click OK.
- In order to present this option to the user, right click ‘County Parameter’ under ‘Parameters’ sub tab and select ‘Show Parameter Control’.

Running the report
- Click ‘Presentation Mode’ OR press F-7 to preview. Select a country from ‘Country Parameter’ list to show its result. Your first report with an extract criterion is complete!


