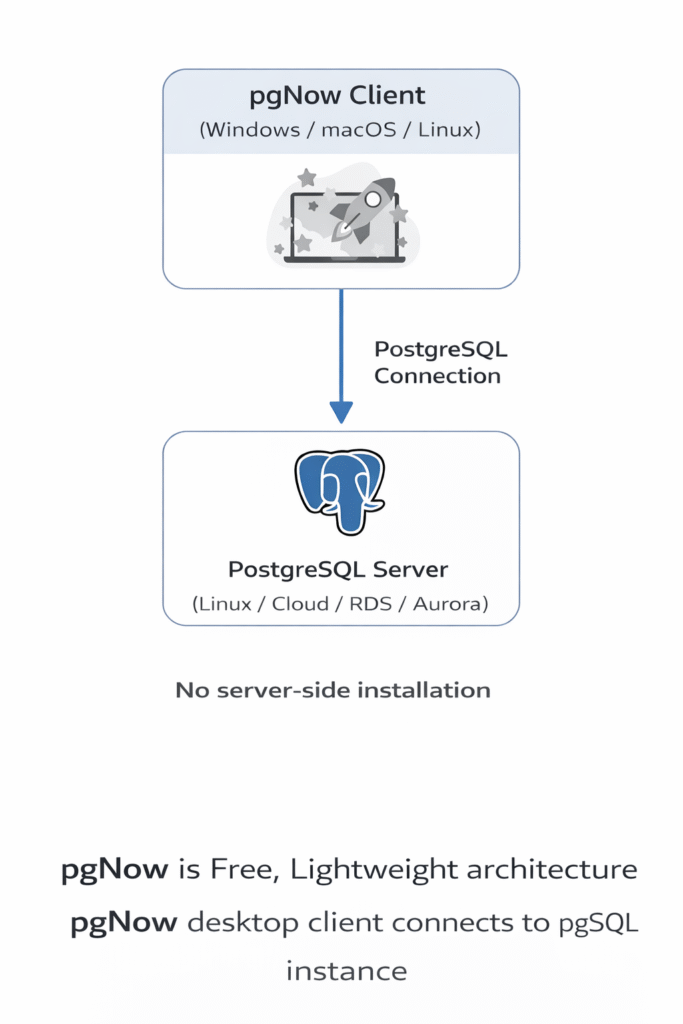
pgNow is a lightweight PostgreSQL diagnostic tool developed by Redgate that provides quick visibility into database performance without requiring agents or complex setup. It connects directly to a PostgreSQL instance and delivers real-time insights into query workloads, active sessions, index usage, configuration health, and vacuum activity, helping DBAs quickly identify performance bottlenecks. Because it runs as a simple desktop application, pgNow is particularly useful for quick troubleshooting and point-in-time diagnostics when a full monitoring platform is not available.
The tool is currently free to use, and its development is actively maintained by Redgate, with potential future enhancements expected as the project evolves. It analyzes workload behavior using PostgreSQL system views and extensions such as pg_stat_activity and pg_stat_statements.
Prerequisites
Enable pg_stat_statements in PostgreSQL
Most PostgreSQL distributions already include the pg_stat_statements extension. You only need to enable it in shared_preload_libraries and create the extension in the database
Create the extension
CREATE EXTENSION pg_stat_statements;
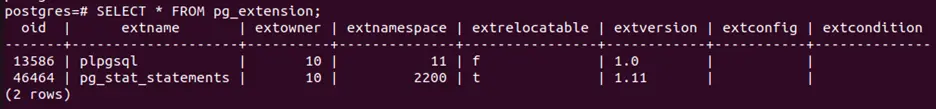
Verify the Extension
Configure Statement Tracking:
Set the tracking level to capture all statements:
ALTER SYSTEM SET pg_stat_statements.track = 'all';
Reload configurations:
SELECT pg_reload_conf();
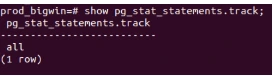
Verify the setting:
CREATE USER monitor_user WITH PASSWORD '123#abc';

 -- Grant connection permission

GRANT CONNECT ON DATABASE myoddodb TO monitor_user;

 -- Grant usage on schema (adjust schema name if needed)

GRANT USAGE ON SCHEMA public TO monitor_user;

-- Grant specific table permissions for monitoring

GRANT SELECT ON pg_stat_activity TO monitor_user;

GRANT SELECT ON pg_stat_database TO monitor_user;

GRANT SELECT ON pg_stat_all_tables TO monitor_user;

GRANT SELECT ON pg_stat_user_tables TO monitor_user;

GRANT SELECT ON pg_statio_user_tables TO monitor_user;

GRANT SELECT ON pg_stat_all_indexes TO monitor_user;

GRANT SELECT ON pg_stat_user_indexes TO monitor_user;

GRANT SELECT ON pg_statio_user_indexes TO monitor_user;

GRANT SELECT ON pg_locks TO monitor_user;

GRANT SELECT ON pg_database TO monitor_user;

GRANT SELECT ON pg_tables TO monitor_user;

GRANT SELECT ON pg_indexes TO monitor_user;

GRANT SELECT ON pg_views TO monitor_user;

 -- For pg_stat_statements (if extension is installed)

GRANT SELECT ON pg_stat_statements TO monitor_user;


-- Grant permissions to see table sizes and statistics

GRANT SELECT ON pg_class TO monitor_user;

GRANT SELECT ON pg_namespace TO monitor_user;

 -- Additional useful views for monitoring

GRANT SELECT ON pg_settings TO monitor_user;

GRANT SELECT ON pg_roles TO monitor_user;

GRANT SELECT ON pg_authid TO monitor_user;

 -- For vacuum and maintenance monitoring

GRANT SELECT ON pg_stat_progress_vacuum TO monitor_user;

 -- For replication monitoring (if using replication)

GRANT SELECT ON pg_replication_slots TO monitor_user;

GRANT SELECT ON pg_stat_replication TO monitor_user;

GRANT SELECT ON pg_stat_wal_receiver TO monitor_user;

 -- Grant execute permission on useful monitoring functions

GRANT EXECUTE ON FUNCTION pg_size_pretty(bigint) TO monitor_user;

GRANT EXECUTE ON FUNCTION pg_database_size(oid) TO monitor_user;

GRANT EXECUTE ON FUNCTION pg_database_size(name) TO monitor_user;

GRANT EXECUTE ON FUNCTION pg_relation_size(regclass) TO monitor_user;

GRANT EXECUTE ON FUNCTION pg_table_size(regclass) TO monitor_user;

GRANT EXECUTE ON FUNCTION pg_indexes_size(regclass) TO monitor_user;

GRANT EXECUTE ON FUNCTION pg_total_relation_size(regclass) TO monitor_user;

GRANT EXECUTE ON FUNCTION pg_stat_get_activity(integer) TO monitor_user;

GRANT EXECUTE ON FUNCTION pg_reload_conf() TO monitor_user;

GRANT pg_monitor TO monitor_user;

GRANT pg_read_all_settings TO monitor_user;

GRANT pg_read_all_stats TO monitor_user;

GRANT pg_stat_scan_tables TO monitor_user;
Download and Install pgNow
In this guide, I am demonstrating the installation process on Ubuntu (22.04.5 LTS). For Windows, the process is simpler: download the installer, run it, create a Redgate account, and connect to your PostgreSQL database.
On Linux, pgNow should be executed as a regular user rather than the root user. Since pgNow is built using Electron, running it as root without disabling the sandbox is not supported and will result in an error. Therefore, it is recommended to run the application using a normal user account.
Install pgNow on Linux
Create a separate directory for pgNow:
mkdir pgnow
Place the downloaded Linux package in this directory. Extract the package.
tar -xvzf pgNowLinuxX64.tar.gz
You should now see the pgNow executable. If required, grant execute permission.
Start the application
./pgNow
Getting Started with pgNow: Login and Connect to PostgreSQL
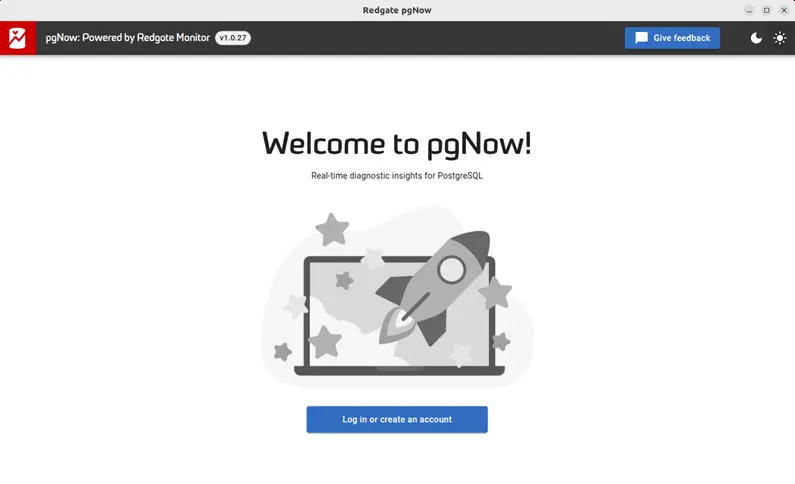
After installation, launch pgNow. The first screen will display the license agreement. Accept the license terms to continue.Next, you will see the login or create account screen, where you can sign in with your Redgate account.
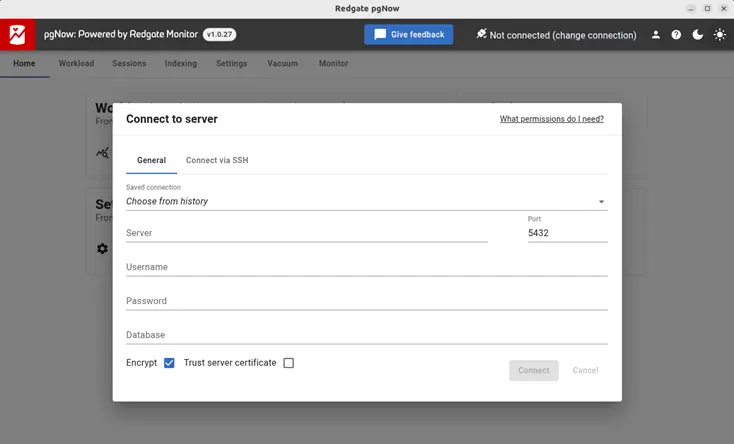
After logging in, you will see the Connect to Server page for the database connection. As shown in the screenshot below, enter your database details and log in using the monitoring user we created earlier.
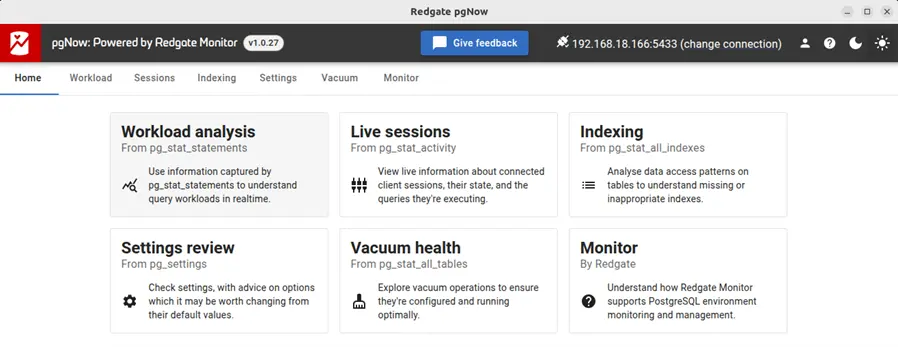
After connecting to the database, you will see several sections on the Home page. Each section is explained below with screenshots.
Workload Analysis
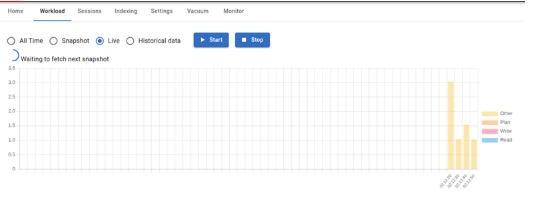
By combining data from the widely used pg_stat_statements extension with time-based analysis, pgNow provides insights into the current workload running on the database.
It offers four main views:
- All Time: Displays statistics for all recorded SQL statements.
- Snapshot: Shows a snapshot of query activity at a specific point in time.
- Live: Displays real-time query activity as it happens.
Historical Data: Allows you to review workload patterns from previously captured data.
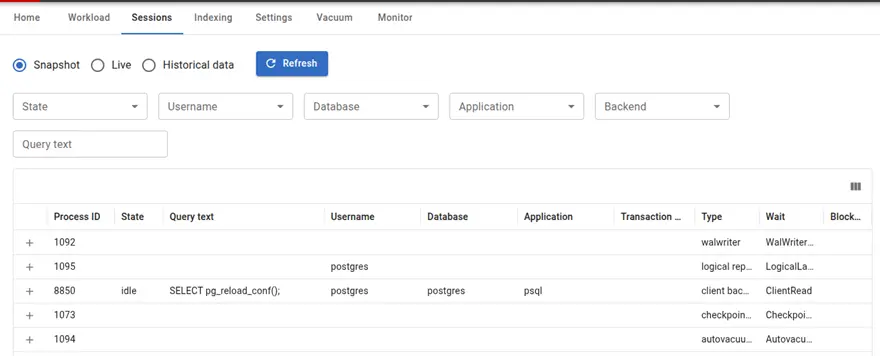
Live Sessions
The Live Sessions section displays point-in-time information from pg_stat_activity, including currently running queries, active processes, and the events they are waiting on.
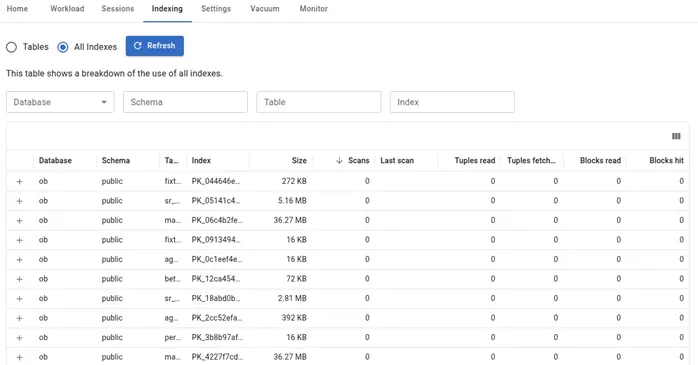
Indexing
The Indexing section displays metrics on table and index usage, helping identify tables that may benefit from additional indexes and highlighting indexes that are duplicated or unused.
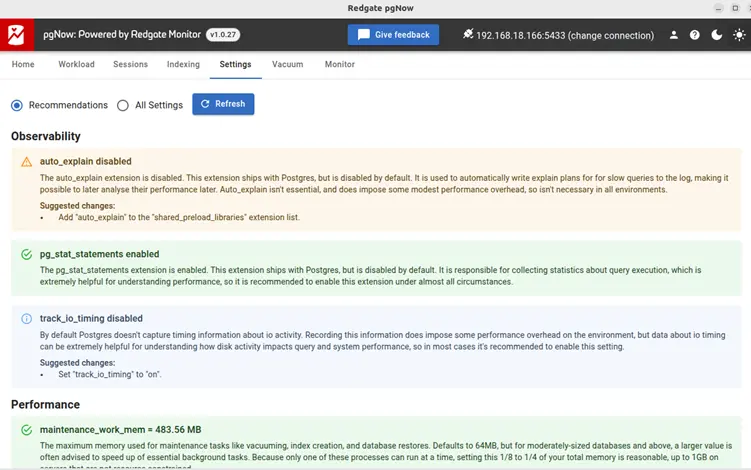
Settings
The Settings section displays the current database configuration along with recommendations to help improve performance and follow best practices.
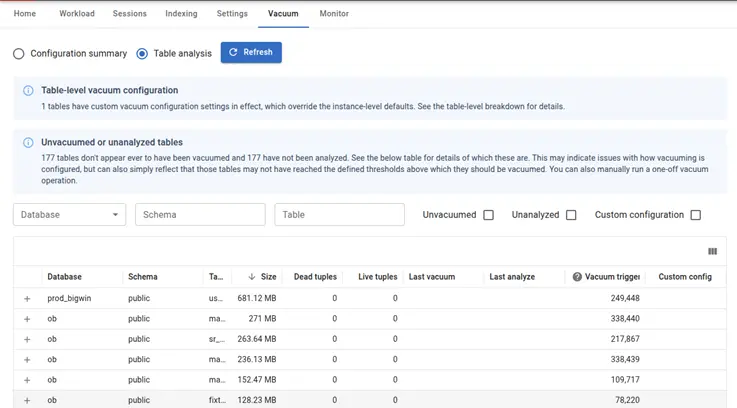
Vacuum
The Vacuum section analyzes the health of vacuum operations on your tables and highlights configuration opportunities to improve overall vacuum efficiency and database health
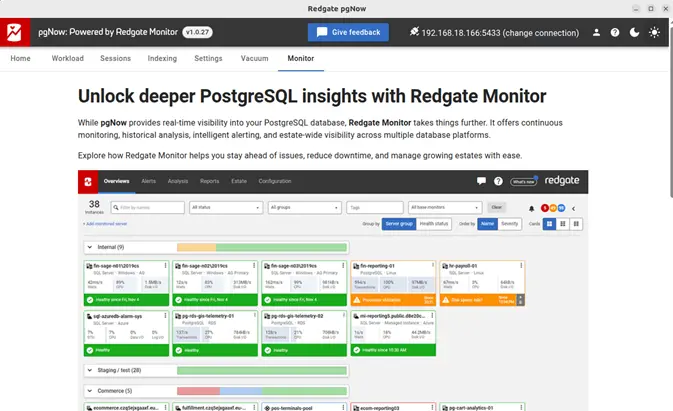
Monitor
The Monitor section integrates with Redgate Monitor, Redgate’s commercial monitoring platform for PostgreSQL. This feature allows users to transition from point-in-time diagnostics in pgNow to continuous performance monitoring, alerting, and historical analysis.
Final Thoughts
pgNow is a practical tool for quickly diagnosing PostgreSQL performance issues without deploying a full monitoring stack. Its simple setup and focused dashboards make it useful for DBAs and developers who need fast insights during troubleshooting or performance reviews. As the project continues to evolve under Redgate, it has the potential to become an even more valuable companion tool for PostgreSQL diagnostics.