
In the realm of database management, ensuring data consistency and minimizing replication lag is crucial, especially in a multi-master PostgreSQL cluster where data is being simultaneously written across multiple nodes.
One powerful tool that can aid in this task is Postgres Enterprise Manager (PEM). PEM offers comprehensive monitoring and management capabilities for PostgreSQL databases, including the ability to set up alerts for various metrics.
In this blog post, we will delve into the process of creating alerts in PEM specifically to monitor replication lag in a PostgreSQL multi-master cluster, helping database administrators to promptly address any latency issues and maintain optimal database performance. If you want to know how to create the Multi-Master architecture and PEM from a browser do read out our previous blog: Deploying PostgreSQL Multi-Master Multi-Zone Architecture on AWS
Make sure PEM is accessible from the browser and we can log in with EnterpriseDB user.
Enable Probe
In Postgres Enterprise Manager (PEM), probes are essentially scheduled tasks that gather information about the database objects being monitored by the PEM agent. This information is then used by PEM to generate the graphs and reports you see on the PEM interface.
We need to enable a system Prob named PGD Node Slots for our requirement.
From the left panel click on PEM Server Directory and expand it then right-click on Kaboom node and select Management and Manage probes.
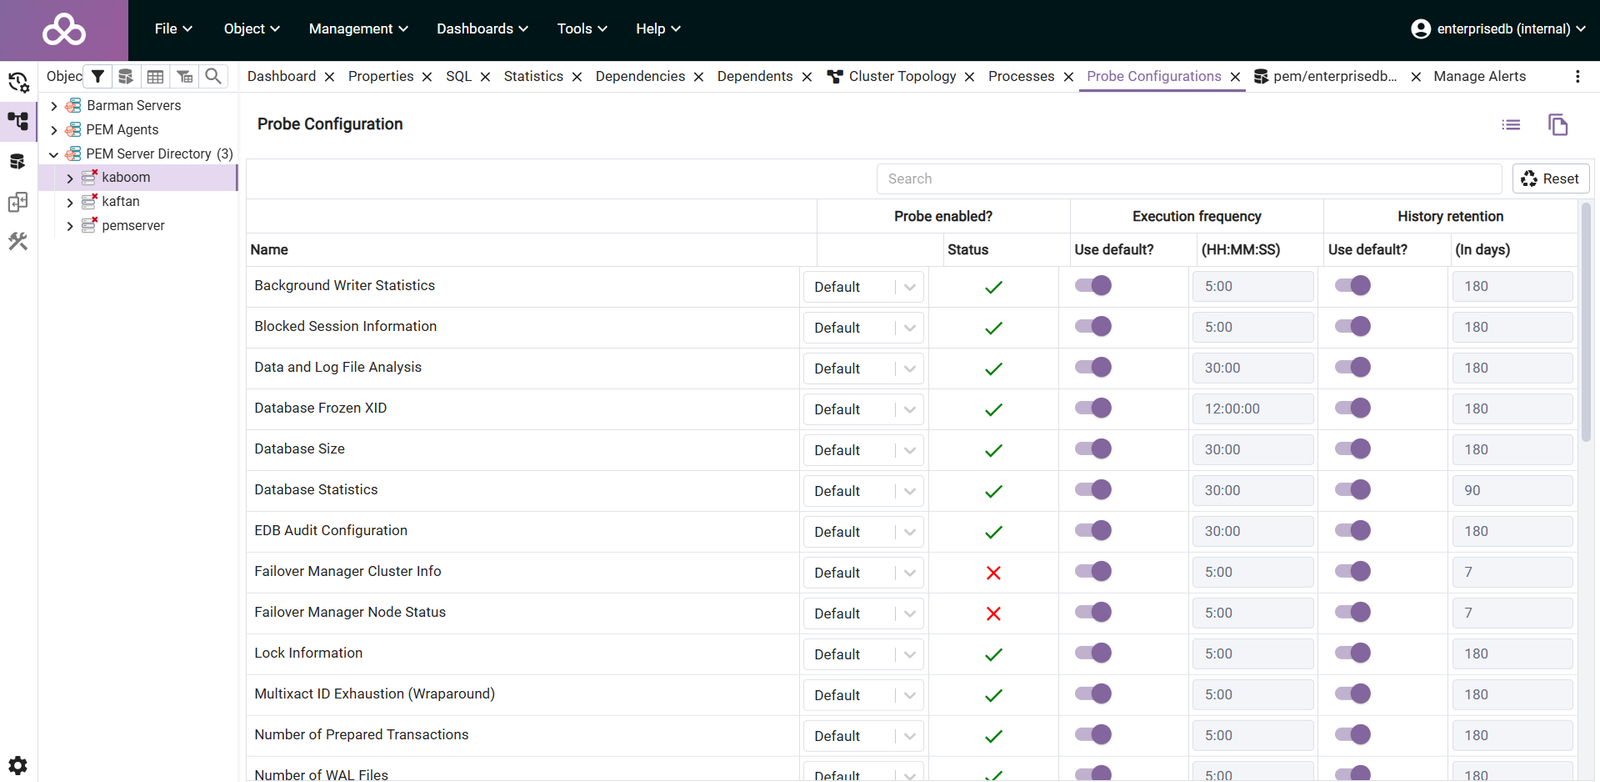
From the next screen select the Manage Custom Probes option and then select Show System Probes? option to list down the available probes. Search for PGD Node Slots prob and enable it.
After enabling the required prob save the settings by clicking on the save icon appearing right below to Show System Probes? option.
Create Alert template
An alert template is a pre-defined format for notification messages sent by monitoring systems. It allows you to customize the content of alerts with static text and dynamic variables (e.g., error code, device name) for clearer and more informative alerts.
From the left panel click on PEM Server Directory and expand this then right-click on Kaboom node and select Management and Manage Alerts from the next screen click on the + icon to create the new alert template.
Inside the General Tab update the following fields
- Template name
- Description
- Target type
- Threshold unit
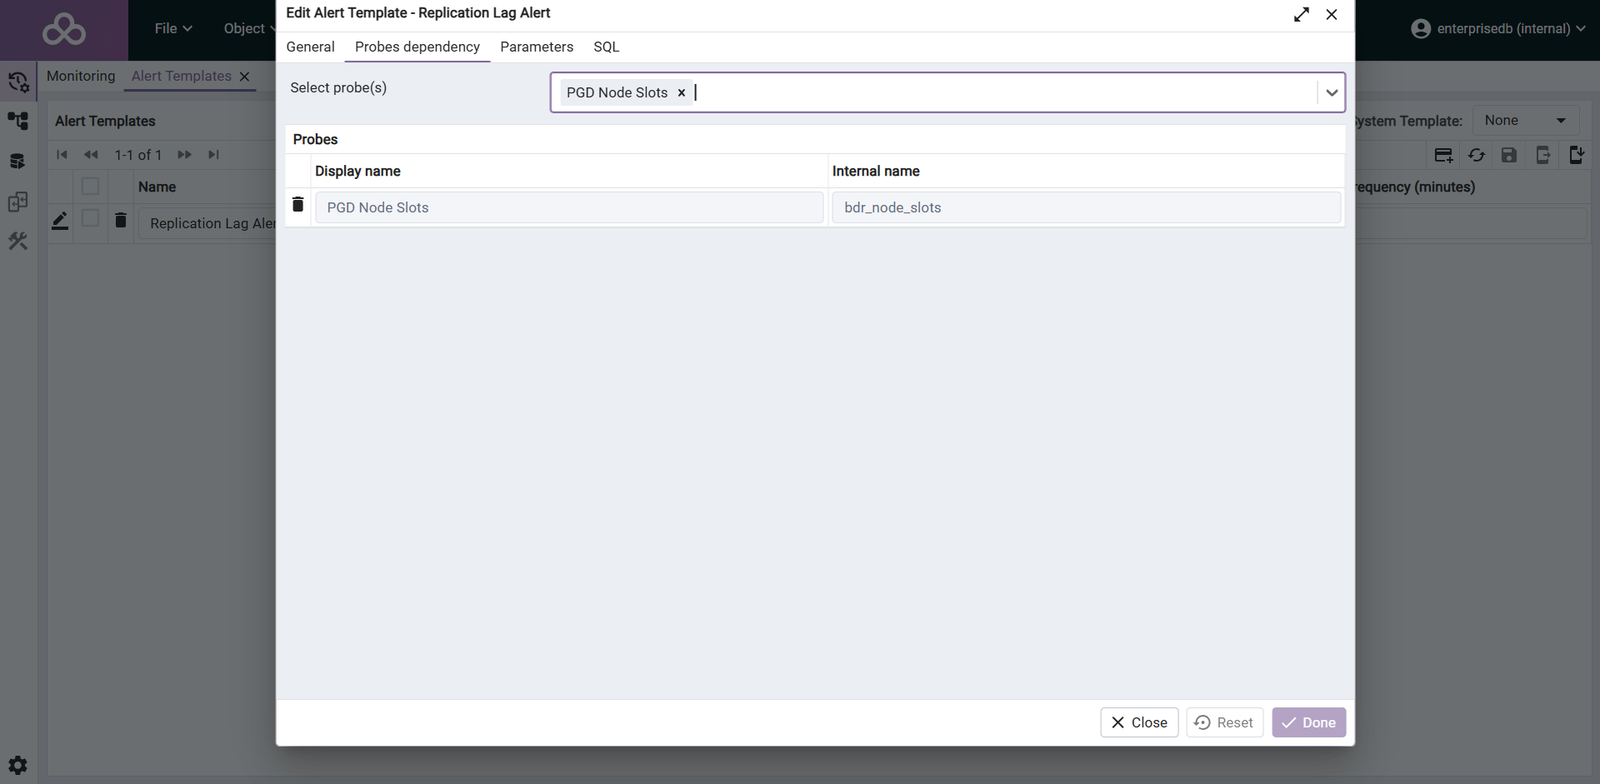
Go to the next tab which is Prob Dependency
- Search/Select PGD Node Slots
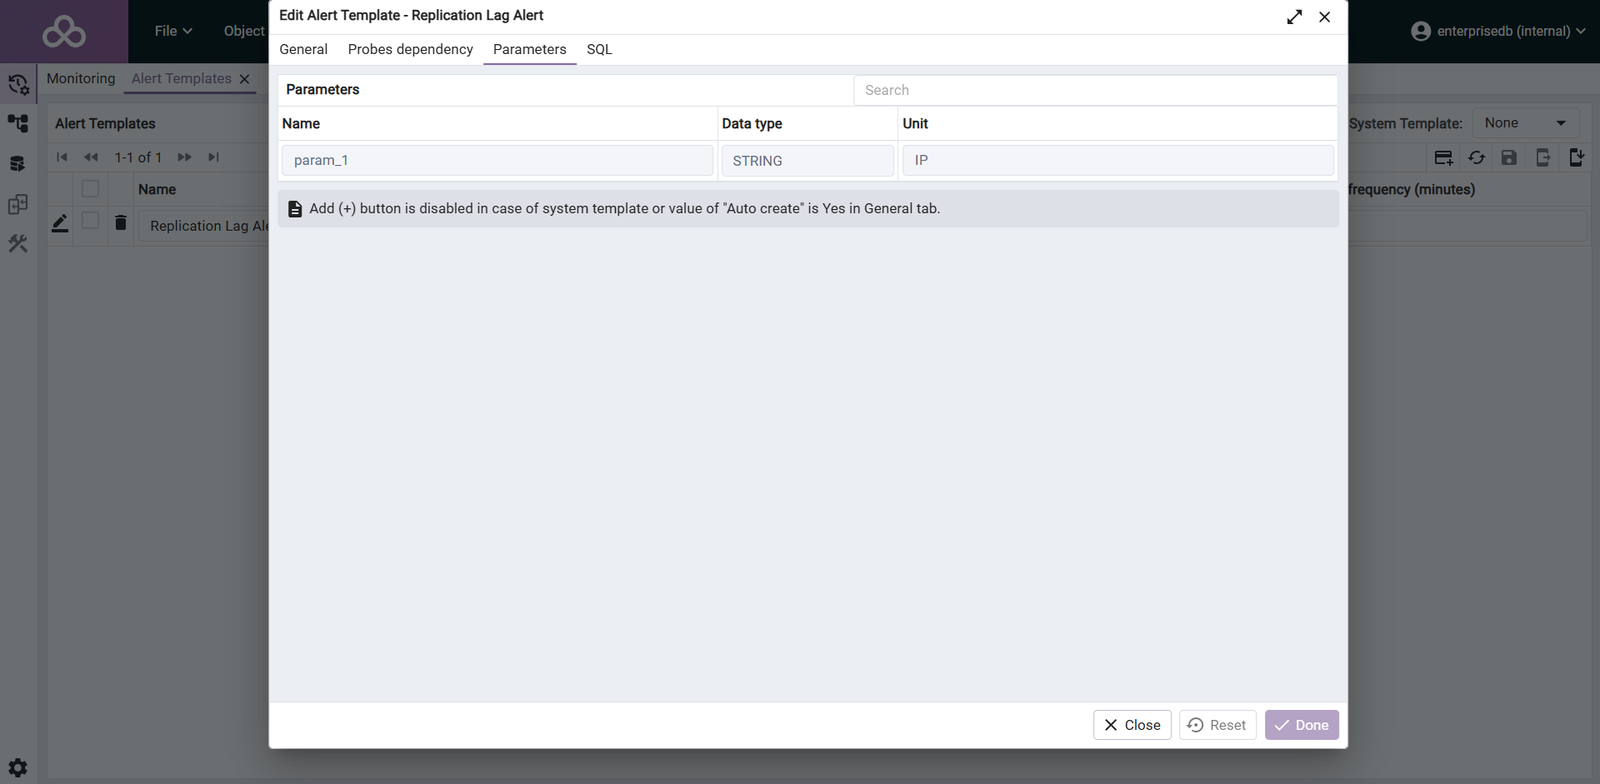
Go to the next tab Parameters. Update the following parameters:
- Name
- Data type
- Unit
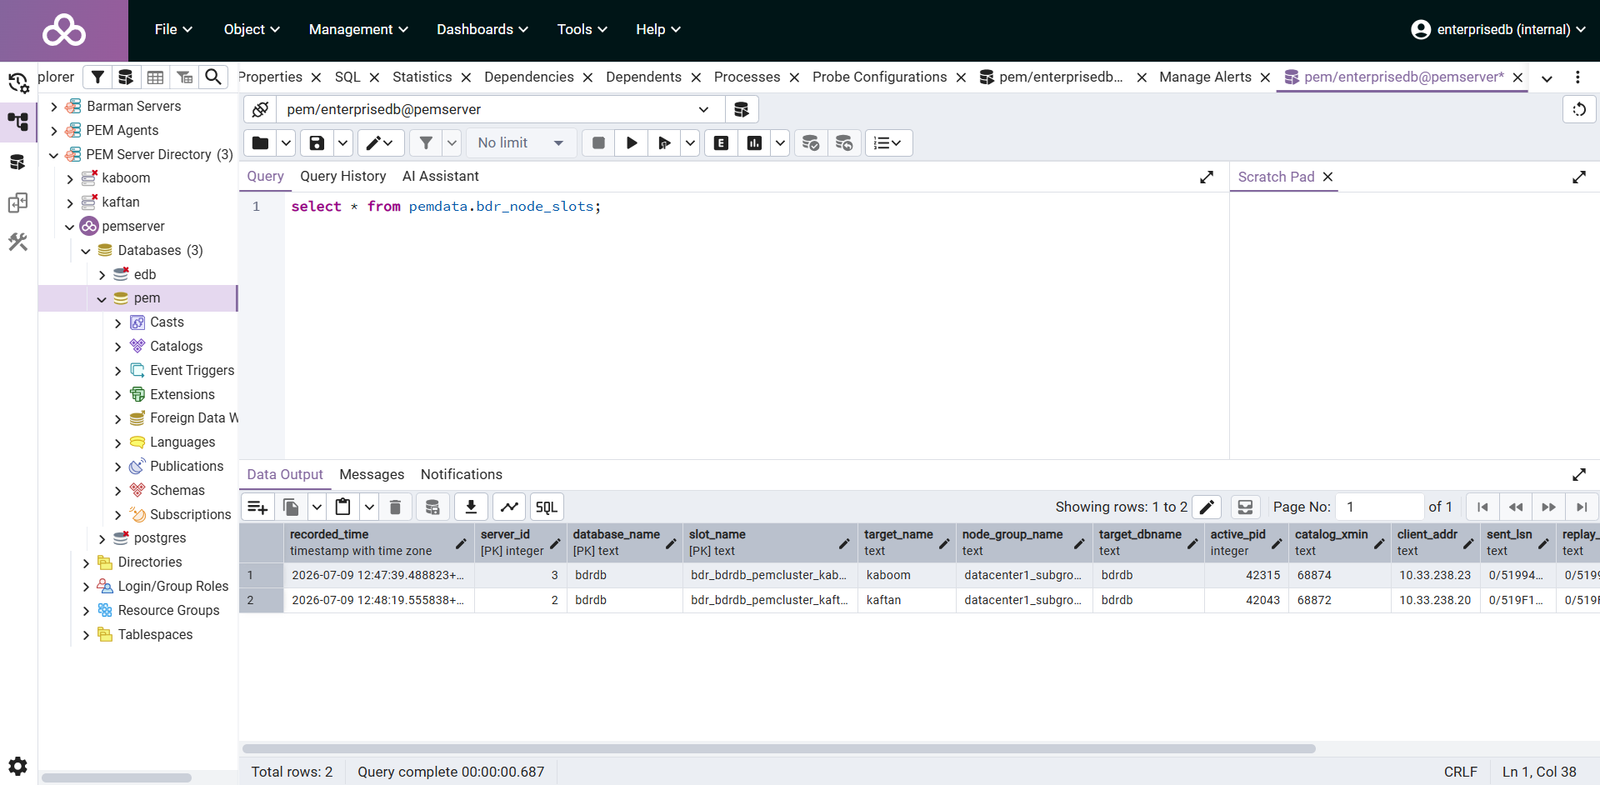
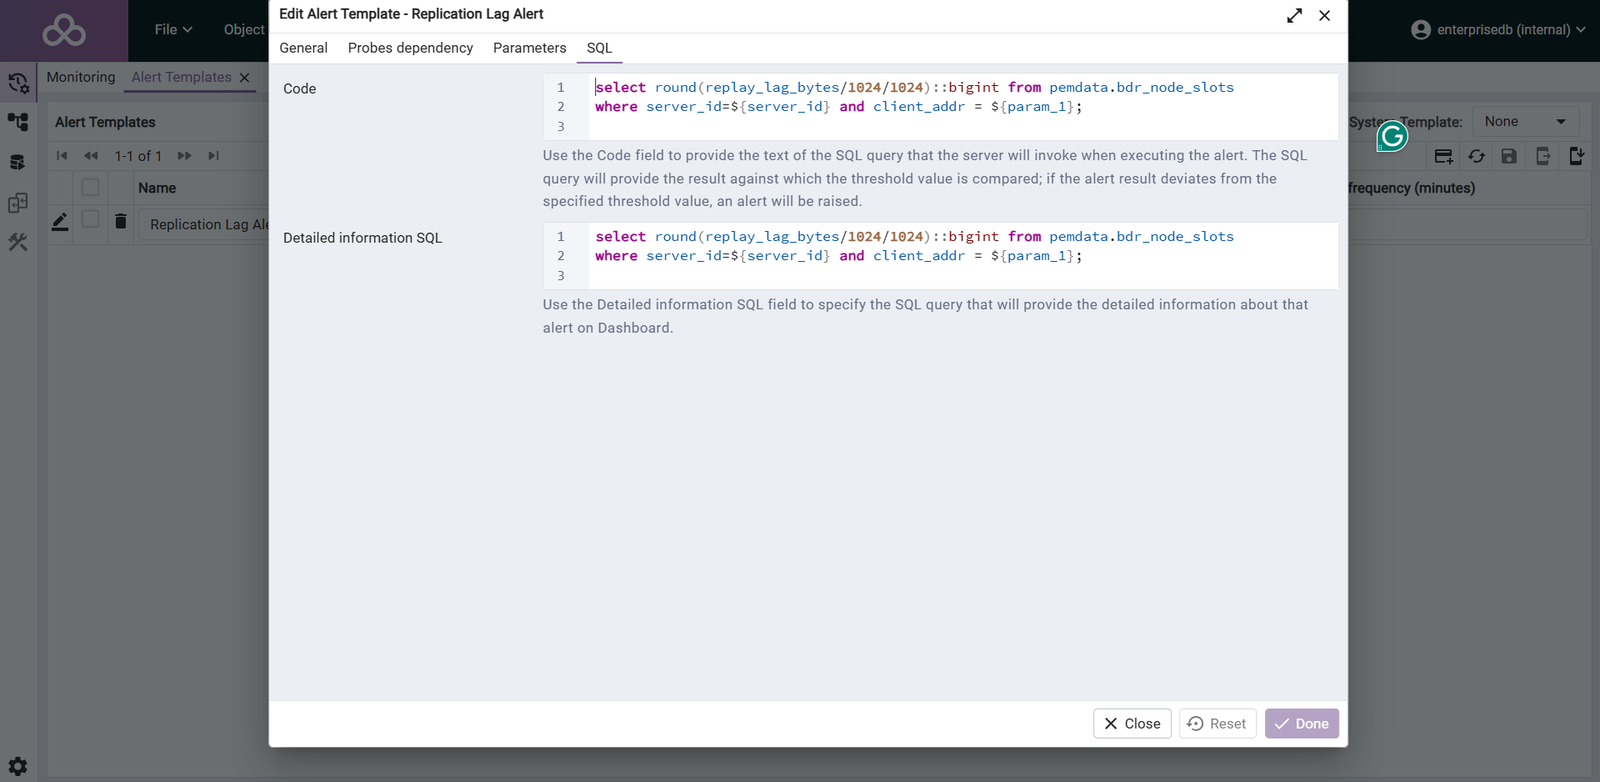
Go to the SQL tab. Here we are going to write a query that will be run on each node in the cluster and return us the replication lag.
select round(replay_lag_bytes/1024/1024)::bigint from pemdata.bdr_node_slots where server_id=${server_id} and client_addr = ${param_1};
Save that template.
Create Alerts
In our current setups where every node is replicating data to other nodes, we need to create alerts for each 1 node i.e from kaboom to karakul, kaboom to kaput and kaboom to kaolin etc.
From the left panel click on PEM Server Directory and expand this then right-click on Kaboom node and select Management and Manage alerts
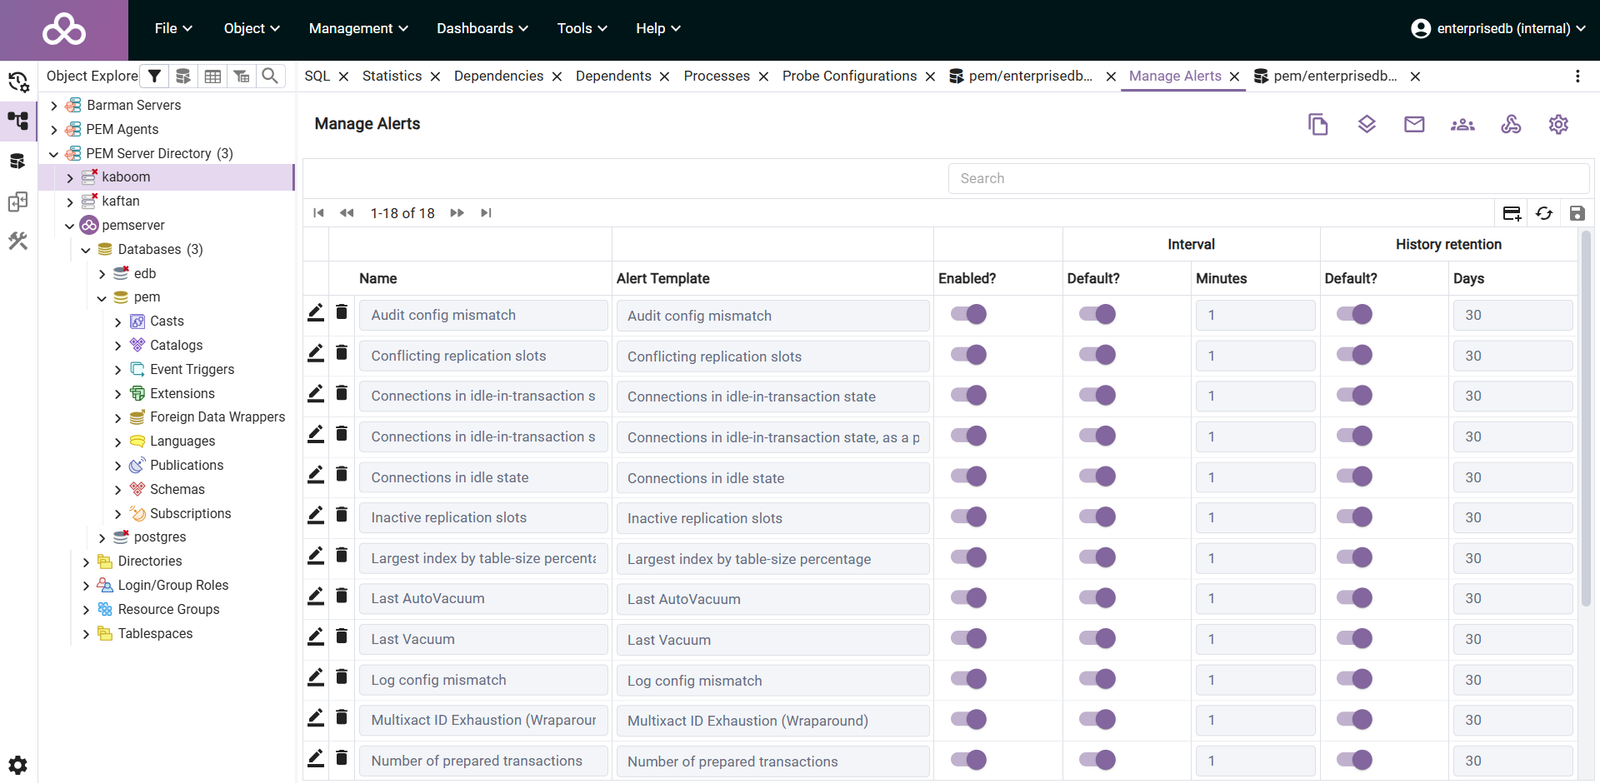
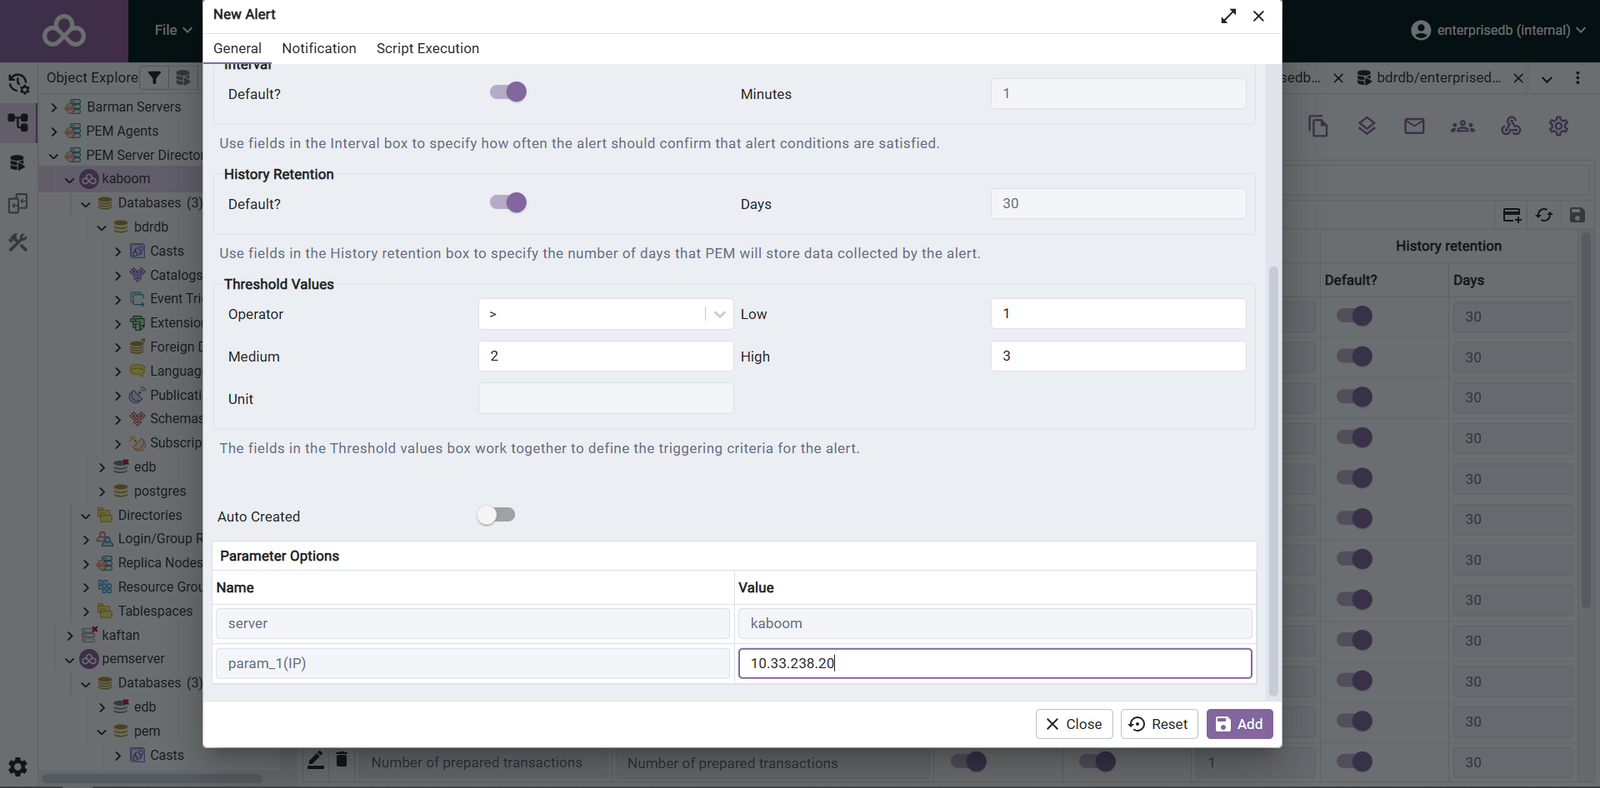
We will generate alerts based on the replication lag size as follows: if the lag size exceeds 1 MB, a low-priority alert will be triggered; if it exceeds 2 MB, a medium-priority alert will be issued; and if it exceeds 3 MB, a high-priority alert will be generated.
Create Replication Lag
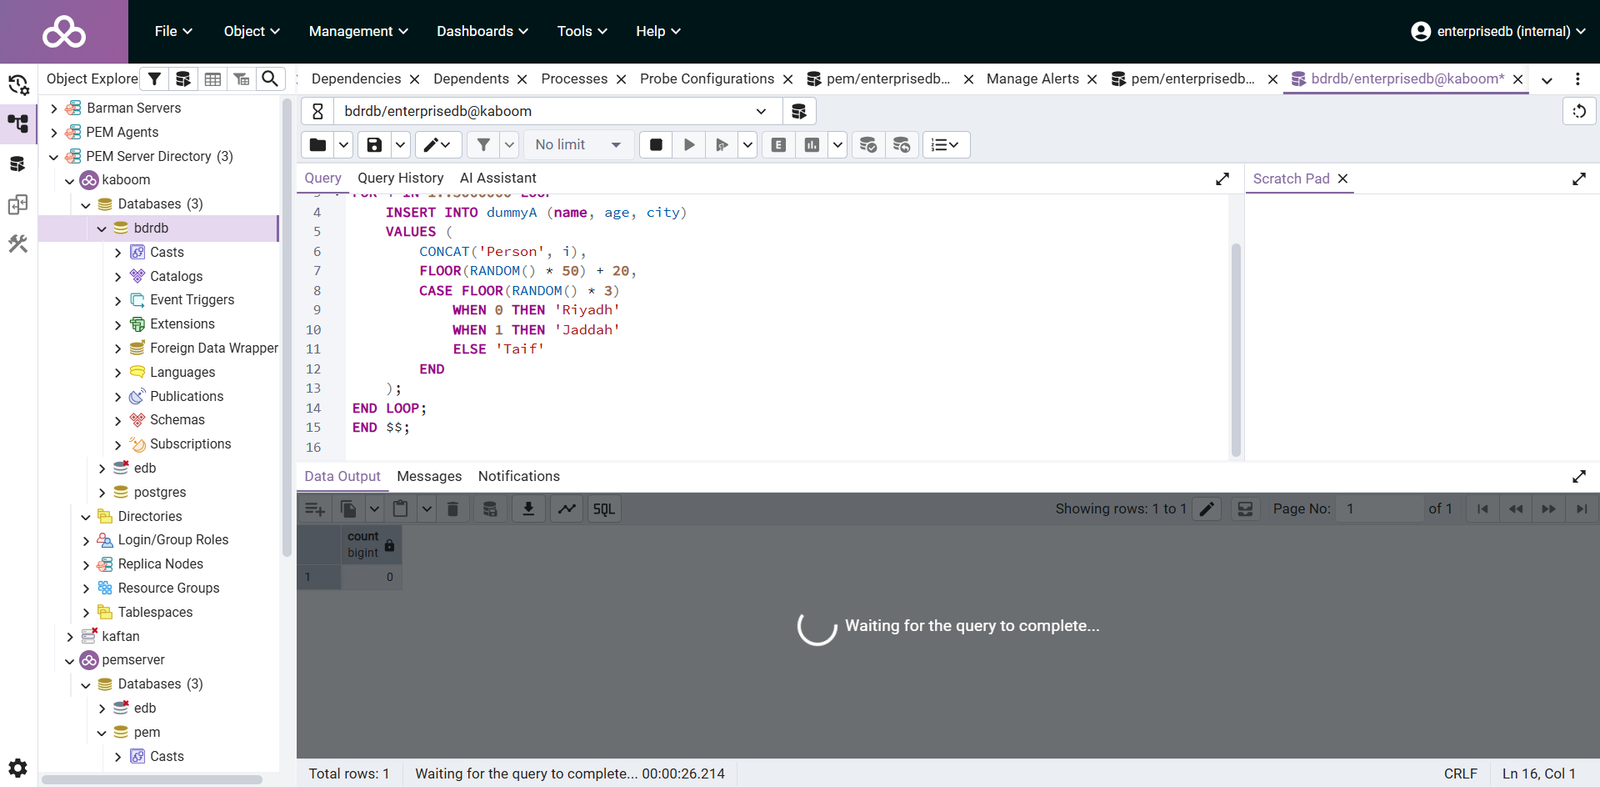
To create replication lag we are going to connect with psql from the Kaboom node and try to create a table and insert some large number of data in this table so that we can achieve some sort of replication lag
CREATE TABLE dummyA (
         id SERIAL PRIMARY KEY, name VARCHAR(50), age INT,
          city VARCHAR(50));
Insert data inside the table. We are going to insert 30M rows inside the table
DO $$
BEGIN
FOR i IN 1..30000000 LOOP
    INSERT INTO dummyA (name, age, city)
    VALUES (
        CONCAT('Person', i),
        FLOOR(RANDOM() * 50) + 20,
        CASE FLOOR(RANDOM() * 3)
            WHEN 0 THEN 'Riyadh'
            WHEN 1 THEN 'Jaddah'
            ELSE 'Taif'
        END
    );
END LOOP;
END $$;
While the above SQL query is in progress let’s now head back to the PEM server and go inside the alerts tab to see if we can get any alerts for replication Lag.
OK so Alerts started to appear.
We are successfully able to implement replication alerts with the PEM server.
High Availability & Disaster Recovery: See our multi-node PostgreSQL architecture solution which includes replication and auto-failover, ensuring that your data remains accessible, secure, and always ready to serve your business needs.

